
Donor CRM & lifetime value
Where the Donations Hub is one row per transaction, the Donor CRM is one row per person. It's the system of record for who your donors are, what they care about, and how much they've given over time.
CRM tab — the donor list
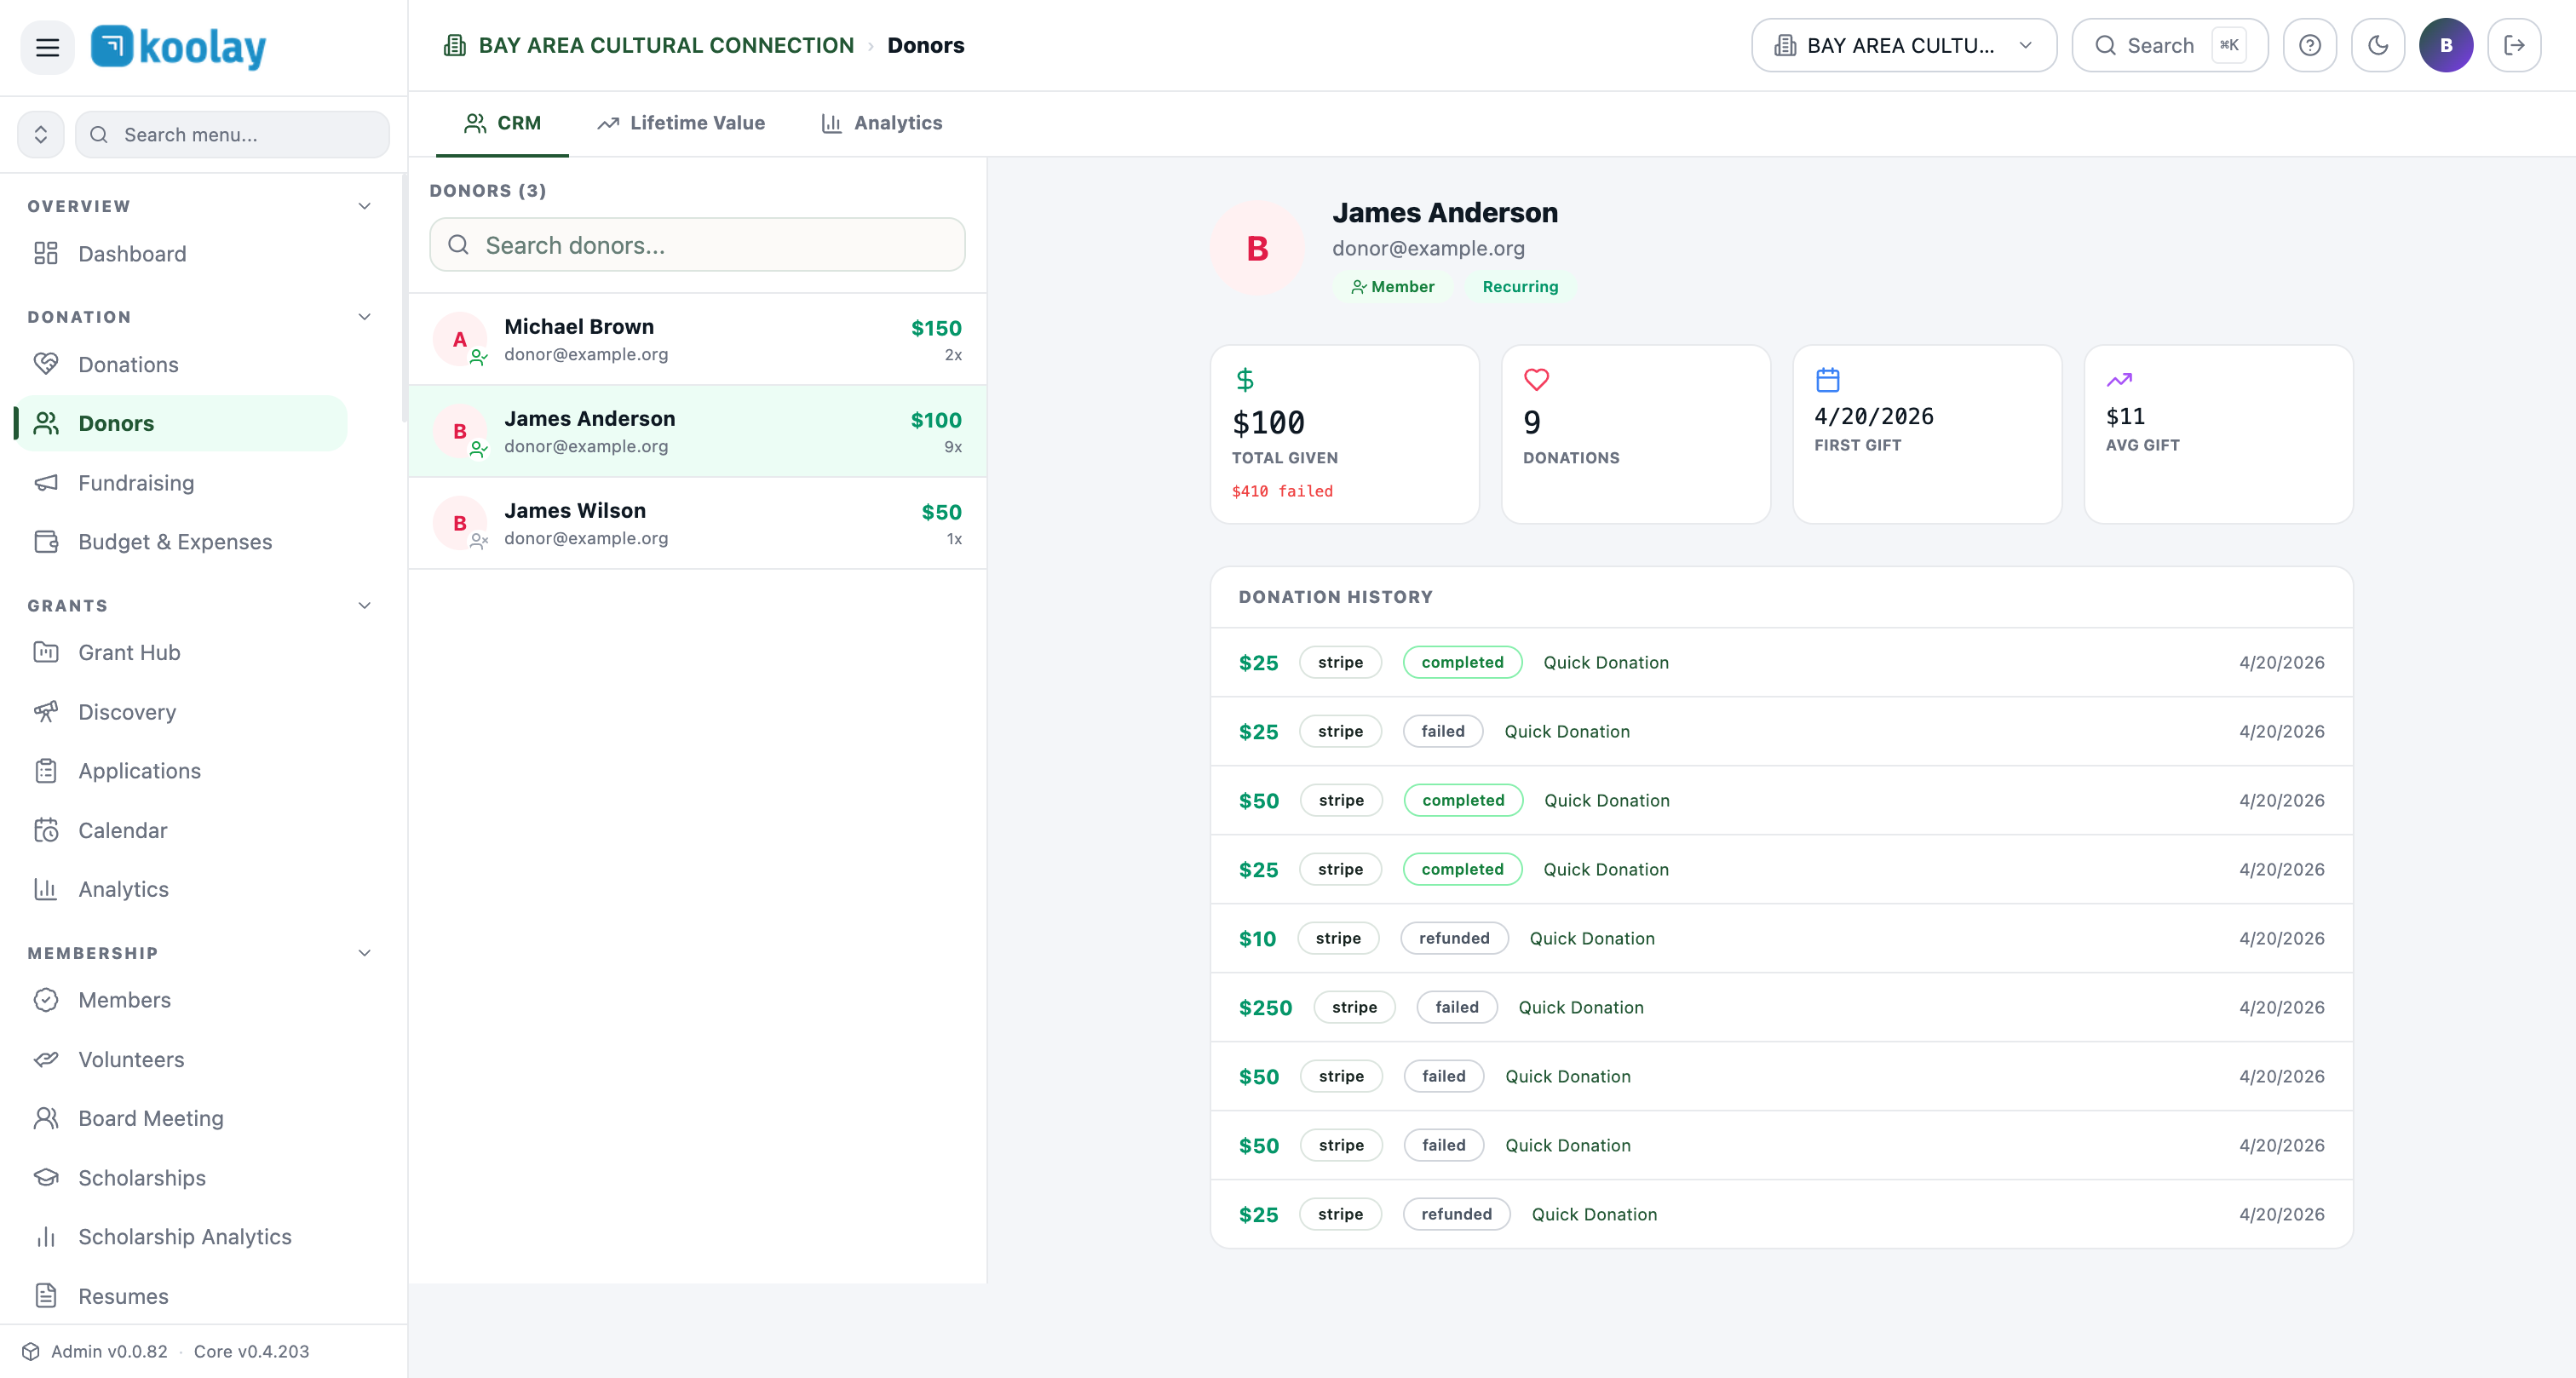
The left pane lists every donor (a person who has at least one donation). For each: name, email, total given, donation count.
Click a donor to open the donor profile in the right pane:
- Header: name, email, member badge, recurring badge.
- Stat row: total given, donation count, first gift date, average gift.
- Donation history: every donation, with status badges (
completed,failed,refunded). - Notes section (scroll further): free-form notes you can add (e.g. "Met at gala — interested in scholarship program").
Lifetime Value tab — projecting future revenue
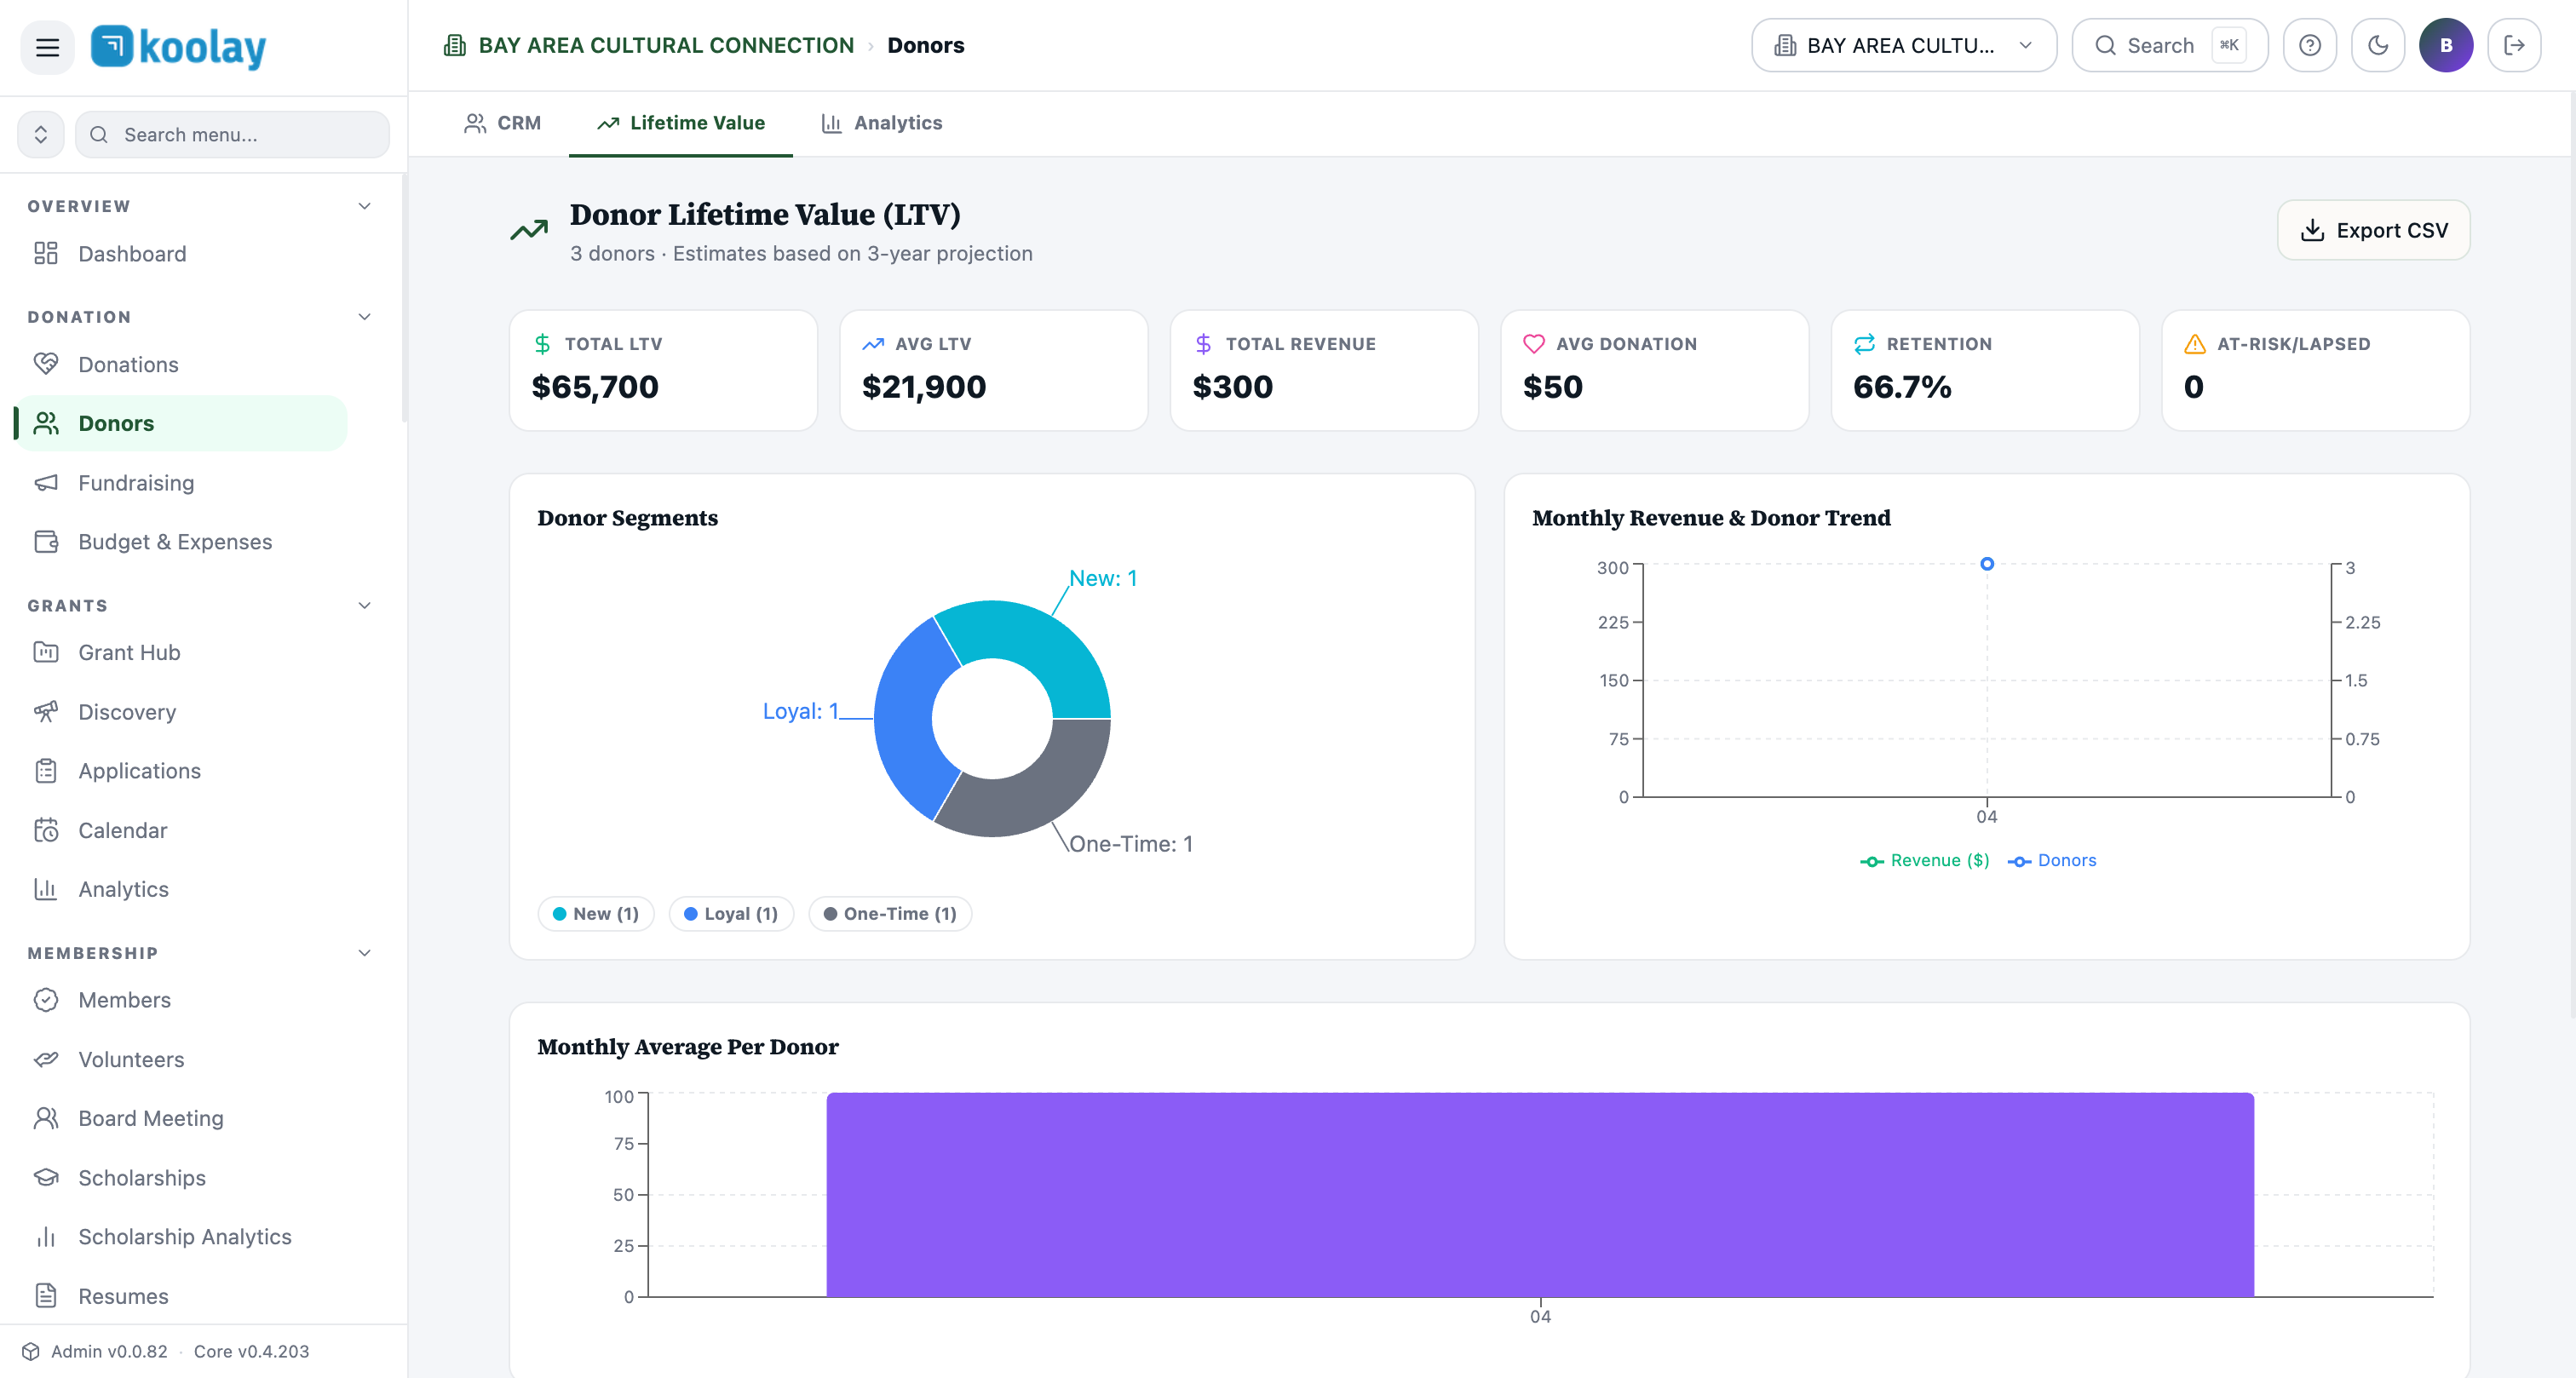
Lifetime Value (LTV) projects what your current donor base is likely to give over the next 3 years, based on their past pattern. It's the single most useful number for planning.
Six key metrics across the top
- Total LTV — projected 3-year revenue from current donors.
- Avg LTV / Donor — the same number divided by donor count. Tells you what a "typical" donor is worth.
- Total Revenue — actual dollars received (this is real, not projected).
- Avg Donation — mean gift size.
- Retention — percent of donors who gave again within 12 months.
- At-Risk / Lapsed — donors whose pattern says they're about to stop giving.
Donor segments
Donors are auto-classified into:
- New — first gift in last 90 days.
- One-Time — gave once, no follow-up gift.
- Loyal — gave 3+ times across multiple years.
- Major — single gifts above the major-gift threshold (configurable per tenant).
- Lapsed — gave previously but nothing in 18+ months.
The donut chart shows the segment mix at a glance.
Charts
- Monthly Revenue & Donor Trend — overlay of dollars and unique donors. When the donor count rises faster than dollars, you're growing breadth (good for stability). When dollars rise faster than donors, you're growing depth (also good — your existing donors are upgrading).
- Monthly Average Per Donor — the per-donor average each month. A flat line means stable; a trending-up line means donors are giving more per gift over time.
The donor table at the bottom
Sortable by total, count, average, segment, or projected LTV. Use the LTV column for major-donor prospecting — donors with the highest projected value (not the highest single gift) are who to cultivate next.
How LTV is calculated
For each donor:
- Estimate annual giving from their actual donation cadence (frequency × average amount).
- Project forward 3 years, applying a discount for retention probability based on segment.
- Sum across all current donors → Total LTV.
The math is intentionally conservative — actual results usually beat the projection, especially if you cultivate effectively.
Common patterns
- Major-gift cultivation — sort by projected LTV, focus on top 20%.
- Retention work — filter to "At-Risk" segment; that's your save-list.
- Board reports — Total LTV is the metric that resonates with directors used to thinking about pipeline value.