
Reading your dashboard
The Dashboard is the first thing you see when you open the admin panel. It's an at-a-glance pulse of the organization — designed to fit in one screen and give you "is everything OK?" in five seconds.
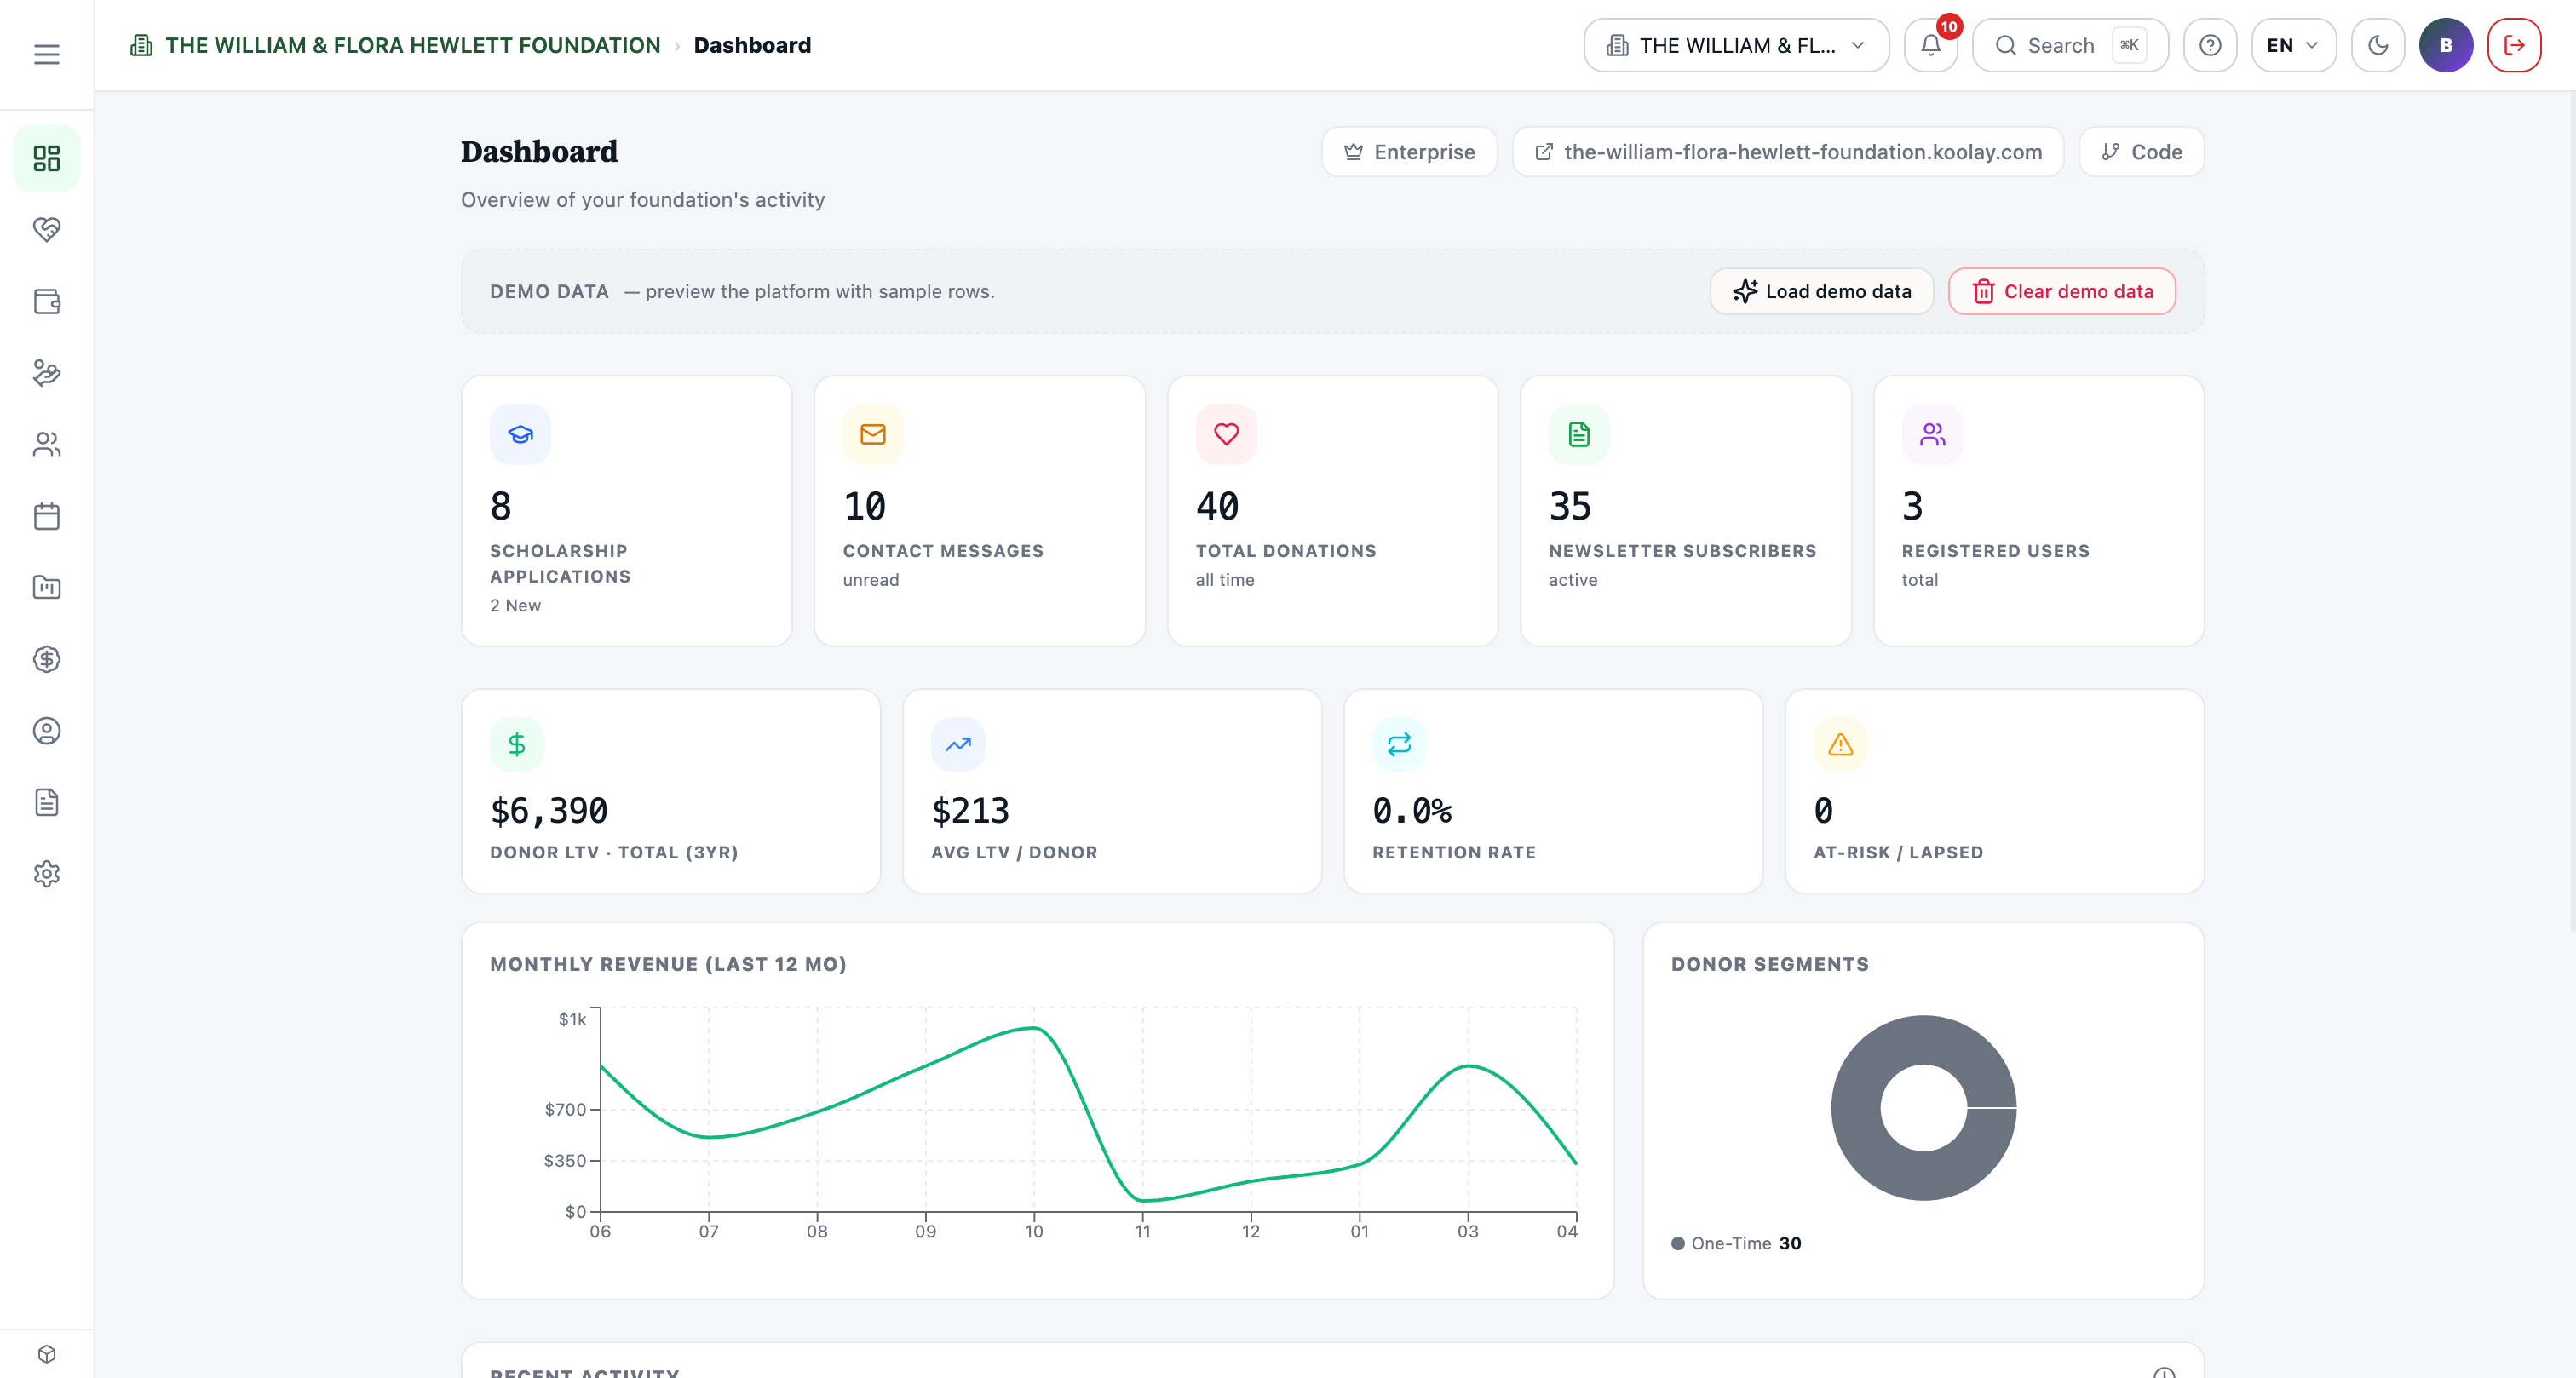
The top row — quick counts
Five tiles, each with a count and a small qualifier:
- Scholarship applications — total, plus how many are new (need review).
- Contact messages — total, plus how many are unread.
- Total donations — all-time, lifetime tally.
- Newsletter subscribers — total, plus how many are active (haven't unsubscribed).
- Registered users — every account that has ever logged into your public site.
Click any tile to jump straight to the matching panel.
Donor lifetime value (LTV) row
Five tiles that summarize donor health. These are projected over a 3-year window using actual donation cadence:
- Donor LTV — Total (3yr): projected total revenue from your current donor base over 3 years.
- Avg LTV / Donor: the same number, divided by donor count.
- Retention rate: percent of donors who gave again within 12 months of their first gift.
- At-risk / Lapsed: donors whose pattern says they're about to stop giving (or already have).
- Total donations: this 12-month period.
These come from the Donor LTV panel — see Donor CRM & LTV for how the math works.
Charts
- Monthly revenue (last 12 mo) — line chart of dollars in. Useful for spotting seasonality (year-end spikes, summer dips).
- Donor segments — donut chart showing your donor base broken into New, One-Time, Loyal, Major, and Lapsed segments.
Recent activity
The bottom feed shows the last ~10 platform events: content publishes, user updates, role changes, etc. It's the audit trail equivalent of "what happened on this site today" — useful for spot-checking team activity.
Customizing the dashboard
The default dashboard is fixed for now. If you need a custom view (e.g. for a specific board meeting), use Project Management Hub → Reports to build one with exactly the data you want.
Common questions
Why is my Total donations $300 but my LTV is $65,700? Total donations is actual money received this year so far. LTV is projected revenue from these donors over the next 3 years based on their current giving pattern. Different time windows, different purposes.
Why is my retention rate 0%? Retention requires at least one donor who has given in two different 12-month windows. If your org is brand new, you won't have a meaningful number until ~13 months in.
Why is my dashboard slow to load? First load fetches several aggregations. Subsequent loads use cached values for ~5 minutes, so navigating away and back is fast.